Creating a new dashboard page#
This tutorial walks you through creating a new page for the dashboard step-by-step using Panel and its associated libraries Param, ECharts and Tabulator. It is relevant if you want to add new UI to the dashboard in either Juice Core or a Juice Extension, but is written from the perspective of an extension developer adding a new page to their extension.
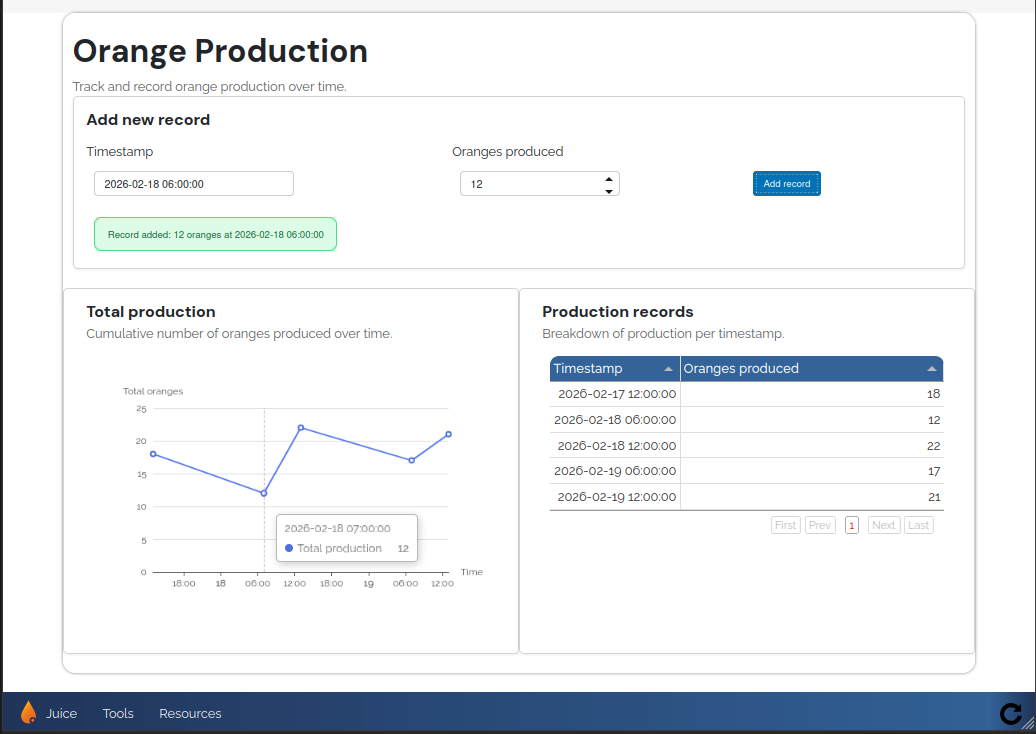
The result of this tutorial will be a new page displaying orange production information featuring input fields, buttons, a user feedback box, a dynamic plot with ECharts and a dynamic table with Tabulator.
Prerequisites#
You have created a Juice extension package to which you want to add a new page. See Creating an extension package.
You have added and registered a configuration folder to your extension package. See Adding a configuration folder.
The extension package is installed in editable mode in your singleuser environment. See Setting up a development environment for an extension.
File Overview#
In this tutorial you will create a HTML file for the layout, an app entrypoint file in Python and a widget logic file also in Python. We will use the following file structure:
your_extension/
├── pyproject.toml
└── src/
    └── <your_extension>/
        ├── __init__.py
        ├── config/
        │   └── dashboard.toml
        └──dashboard/
            ├── __init__.py
            ├── pages/
            │   └── orange_production.py
            │   └── templates/
            │       └── orange-production.html
            └── widgets/
                └── orange_production.py
Everything except for the dashboard folder and dashboard.toml file is boilerplate that should already exist in your extension package.
The rest of the tutorial will guide you through creating the dashboard related files step-by-step.
Setting up the dashboard module#
First, we will set up the dashboard/__init__.py module for our extension.
For now this only defines an environment which can be used to load templates and other resources.
src/<your_extension>/dashboard/__init__.py
from orangeqs.juice.dashboard import JuiceEnvironment

environment = JuiceEnvironment(extra_template_paths=["<your_extension>.dashboard.pages.templates"])
Don’t forget to replace <your_extension> with the import of your extension package.
Creating a page template#
We will now create our page layout in HTML. OrangeQS Juice uses Bootstrap as its CSS framework. The CSS classes in the template below refer to Bootstrap classes.
There are also content blocks such as extra_resources and content, which are provided by the base_juice template.
These blocks ensure that the page contents are placed in the correct places within the base Juice layout.
A deliberate design choice here is that the template uses semantic structure: headers, sections, cards and wrappers. All layout decisions are made in HTML and CSS. Any widget code will never manipulate the layout of this template.
The template below does not include any widgets yet, we will do that in the next steps.
src/<your_extension>/dashboard/pages/templates/orange_production.html
{% extends "base_juice.html" %}

{% block content %}

<div class="block container">

    <h1>Orange Production</h1>
    <p class="subtitle text-muted">
        Track and record orange production over time.
    </p>

    <section class="card form-card mb-4 shadow-sm">
        <div class="card-body">
            <h2 class="h5 card-title mb-3">Add new record</h2>
            <p>To be implemented...</p>
        </div>
    </section>

    <section class="outputs-grid row g-4">
        <div class="col-12 col-lg-6">
            <div class="card shadow-sm h-100">
                <div class="card-body">
                    <h2 class="h5 card-title mb-1">Total production</h2>
                    <p>To be implemented...</p>
                </div>
            </div>
        </div>

        <div class="col-12 col-lg-6">
            <div class="card shadow-sm h-100">
                <div class="card-body">
                    <h2 class="h5 card-title mb-1">Production records</h2>
                    <p>To be implemented...</p>
                </div>
            </div>
        </div>
    </section>

</div>

{% endblock %}
Creating a page entrypoint#
Next, we write an entrypoint that creates a Panel template to be rendered in our page. Later we will inject our widget here, but for now we will just create a simple template and return it. We also provide our page with a title.
src/<your_extension>/dashboard/pages/orange_production.py
from typing import Any

from panel.template import Template

from .. import environment


def create_orange_production_page(template_variables: dict[str, Any]) -> Template:
    template = environment.get_panel_template("orange_production.html")

    template.add_variable("page_title", "Orange Production")
    for k, v in template_variables.items():
        template.add_variable(k, v)
    return template
We will register the dashboard page in the dashboard.toml configuration file.
This will allow the dashboard to load our page entrypoint on the next time it is started.
src/<your_extension>/config/dashboard.toml
[categories.my-category]
name = "My Category"
order = 25

[categories.my-category.pages.orange-production]
name = "Orange Production"
order = 10
entry_point = "<your_extension>.dashboard.pages.orange_production:create_orange_production_page"
description = "Track and record orange production over time."
Again, replace <your_extension> with the import of your extension package.
Finally, restart your dashboard to reload the dashboard configuration and widget code. This can be done using the button in the bottom-right corner of the dashboard UI. If all goes right, you should see an entry Orange Production appear in the navigation bar on the bottom. Clicking on it will show the page we just created, with some placeholder text where our widget will eventually be.
Tip
Every time you make a change to the Python code, you need to restart your dashboard to apply the changes.
Creating the widget#
We will now implement the logic of the widget.
We start by defining the widget class.
This is primarily a container for state, managed by Param.
Subclassing Parameterized allows us to do this.
Our main state container for this widget is a Pandas DataFrame, which will hold the orange production numbers over time.
Then there are a number of parameters that allow the user to enter new records into our widget, and a feedback string we can use to communicate user errors with.
dashboard/widgets/orange_production.py
from datetime import datetime

from pandas import DataFrame, Series, concat

from param import Date, Integer, Parameterized, String
from param import DataFrame as DF


class OrangeProductionWidget(Parameterized):
    """Widget managing orange production records and visualisations."""

    # List of records:
    # [{"timestamp": datetime, "amount": int}, ...]
    records: DataFrame = DF(DataFrame(
        {
            "timestamp": Series(dtype="datetime64[ns]"),
            "amount": Series(dtype=int)
        }
    ))

    # Form fields
    new_timestamp: datetime = Date(
        default=None,
        doc="Timestamp of the production record.",
    )

    new_amount: int = Integer(
        default=None,
        doc="Number of oranges produced.",
    )

    # User feedback info
    feedback: str = String(default="")
Static type checkers and Param
You may notice a number of warnings from your linter while doing this. Feel free to ignore them, it comes from the fact that Param is not very good with static type checkers.
Next, we will wire these parameters up with their corresponding input widgets.
We use from_param here to ensure our inputs stay in sync with our state parameters.
We also use bind to connect a callback to our button.
When the user adds a new record by clicking the add_button, we want to validate their input and offer feedback in case of user error.
We use CSS classes that we will later add rulesets to visually communicate this.
from typing import Any

from panel import bind, depends
from panel.pane import HTML
from panel.widgets import Button, DatetimePicker, IntInput, Tabulator

from param.parameterized import Event
...

    def __init__(self) -> None:
        super().__init__()

        # ---- form widgets (exposed as roots)
        self.timestamp_input = DatetimePicker.from_param(
            self.param.new_timestamp,
            name="",
            width=250,
        )

        self.amount_input = IntInput.from_param(
            self.param.new_amount,
            name="",
            width=200,
        )

        self.add_button = Button(name="Add record", button_type="primary")
        bind(self._add_record, self.add_button, watch=True)

        self._feedback_display = HTML(bind(str, self.param.feedback))

    def _add_record(self, _: Event) -> None:
        """
        Append a new record using the current form values.

        Validation is handled by Param:
        - new_amount must be an integer
        - must be >= 0
        - must not be empty
        - timestamp must not be empty
        """

        if self.timestamp_input.value is None:
            self.feedback = "Error: Please select a valid timestamp."
            self._feedback_display.css_classes = ["error"]
            return
        if self.amount_input.value is None or self.new_amount < 0:
            self.feedback = "Error: Please enter a valid number of oranges."
            self._feedback_display.css_classes = ["error"]
            return

        new_row = DataFrame({"timestamp": [self.new_timestamp], "amount": [self.new_amount]})

        self.records = concat([self.records, new_row], ignore_index=True) \
            .sort_values("timestamp") \
            .reset_index(drop=True)

        self.feedback = f"Record added: {self.new_amount} oranges at {self.new_timestamp:%Y-%m-%d %H:%M:%S}"
        self._feedback_display.css_classes = ["success"]
Next, we will create our output panes, the ECharts plot and the Tabulator table.
We again use from_param to sync the table with our DataFrame parameter.
For ECharts, we split the configuration in a static and a dynamic part.
We use @depends, provided by Param, to automatically update the plot when the underlying state changes and re-assign the configuration object to our plot to make sure Param detects the change.
from panel.pane import HTML, ECharts
from panel.viewable import Viewable

from orangeqs.juice.dashboard.utils import get_stylesheet
...

    # IMPORTANT! Add the contents of this __init__ with the previous one, do not overwrite it!
    def __init__(self) -> None:
        ...
        # ---- outputs
        self._chart = ECharts(self._empty_chart_option(), height=350, sizing_mode="stretch_width")
        self._table = Tabulator.from_param(
            self.param.records,
            show_index=False,
            sizing_mode="stretch_width",
            layout='fit_data_stretch',
            pagination="local",
            page_size=10,
            titles={
                "timestamp": "Timestamp",
                "amount": "Oranges produced",
            },
            disabled=True,  # Make the table cells non-editable
            stylesheets=[get_stylesheet("custom-bokeh.css")]
        )
        # IMPORTANT! Add the contents of this __init__ with the previous one, do not overwrite it!

    @depends("records", watch=True)
    def _update_chart(self) -> None:
        option = {
            "tooltip": {"trigger": "axis"},
            "xAxis": {
                "type": "time",
                "name": "Time",
            },
            "yAxis": {
                "type": "value",
                "name": "Total oranges",
            },
            "series": [
                {
                    "type": "line",
                    "name": "Total production",
                    "smooth": False,
                    "showSymbol": True,
                    "data": [
                        [ts.timestamp() * 1000, amount]
                        for ts, amount in zip(self.records["timestamp"], self.records["amount"])
                    ]
                }
            ],
        }

        self._chart.object = option

    def _empty_chart_option(self) -> dict[str, Any]:
        return {
            "xAxis": {"type": "time"},
            "yAxis": {"type": "value"},
            "series": [],
            "textStyle": {"fontFamily": "Raleway"}
        }
Make sure to add the content
Lastly, we define a roots function.
This returns a dictionary of the widgets that will be embedded in our template later.
The keys of the dictionary correspond to the names we will use in the template to embed the widgets and the values are the actual Panel objects.
...
    def roots(self) -> dict[str, Viewable]:
        return {
            "timestamp_input": self.timestamp_input,
            "amount_input": self.amount_input,
            "add_button": self.add_button,
            "production_chart": self._chart,
            "production_table": self._table,
            "feedback_box": self._feedback_display
        }
Embedding the widget in the page#
Finally we must embed our widget in the page. To do this, we must:
Instantiate the widget in our page entrypoint and add its roots to the template.
Use the
embedmacro in our template to embed the roots in the correct places.
To instantiate the widget and add its roots to the template, we modify our page entrypoint as follows.
In case something goes wrong we set the load_failed and traceback variables for easy debugging.
src/<your_extension>/dashboard/pages/orange_production.py
import traceback
from typing import Any

from panel.template import Template

from .. import environment
from ..widgets.orange_production import OrangeProductionWidget


def create_orange_production_page(template_variables: dict[str, Any]) -> Template:
    template = environment.get_panel_template("orange_production.html")

    try:
        widget = OrangeProductionWidget()

        for name, root in widget.roots().items():
            template.add_panel(name, root)
    except Exception as ex:
        template.add_variable("load_failed", True)
        template.add_variable("traceback", traceback.format_exc())

    template.add_variable("page_title", "Orange Production")
    for k, v in template_variables.items():
        template.add_variable(k, v)
    return template
To embed the roots in the correct places in our template, we use the embed macro provided by Panel.
This macro takes the name of the root we want to embed as an argument and embeds the corresponding widget in that place in the template.
In our case, we modify the template as follows to embed the form inputs, the feedback box, the chart and the table in the correct places.
We also add some additional CSS classes for the feedback box.
src/<your_extension>/dashboard/pages/templates/orange_production.html
{% extends "base_juice.html" %}

{% block content %}

<style>
/* Success messages (green background) */
.form-feedback .bk-panel-models-markup-HTML.success {
    background-color: #dcfce7; /* light green */
    color: #166534; /* dark green text */
    border: 1px solid #4ade80;
    padding: 0.75rem 1rem;
    border-radius: 8px;
}

/* Error messages (red background) */
.form-feedback .bk-panel-models-markup-HTML.error {
    background-color: #fee2e2; /* light red */
    color: #991b1b; /* dark red text */
    border: 1px solid #f87171;
    padding: 0.5rem 0.75rem;
    border-radius: 8px;
}
</style>

<div class="block container">

    <h1>Orange Production</h1>
    <p class="subtitle text-muted">
        Track and record orange production over time.
    </p>

    <section class="card form-card mb-4 shadow-sm">
        <div class="card-body">

            <h2 class="h5 card-title mb-3">Add new record</h2>

            <div class="form-grid row g-3 align-items-end">
                <div class="form-field col-12 col-md-5">
                    <label class="form-label">Timestamp</label>
                    {{ embed(roots.timestamp_input) }}
                </div>

                <div class="form-field col-12 col-md-4">
                    <label class="form-label">Oranges produced</label>
                    {{ embed(roots.amount_input) }}
                </div>

                <div class="form-actions col-12 col-md-3 d-flex">
                    {{ embed(roots.add_button) }}
                </div>

                <div class="form-feedback col-12">
                    {{ embed(roots.feedback_box) }}
                </div>
            </div>

        </div>
    </section>

    <section class="outputs-grid row g-4">
        <div class="col-12 col-lg-6">
            <div class="card chart-card shadow-sm h-100">
                <div class="card-body">
                    <h2 class="h5 card-title mb-1">Total production</h2>
                    <p class="card-hint text-muted mb-3">
                        Number of oranges produced over time.
                    </p>
                    <div class="chart-wrapper">
                        {{ embed(roots.production_chart) }}
                    </div>
                </div>
            </div>
        </div>

        <div class="col-12 col-lg-6">
            <div class="card table-card shadow-sm h-100">
                <div class="card-body">
                    <h2 class="h5 card-title mb-1">Production records</h2>
                    <p class="card-hint text-muted mb-3">
                        Breakdown of production per timestamp.
                    </p>
                    <div class="table-wrapper">
                        {{ embed(roots.production_table) }}
                    </div>
                </div>
            </div>
        </div>
    </section>

</div>

{% endblock %}
After restarting the dashboard, you should now see a fully functional page where you can add new orange production records, see them in a table and see the total production over time in a plot.
Next steps#
Now that you have added your first widget, it’s time to explore the many possibilities of Panel and its associated libraries to make more complex and interactive widgets. See the Panel Component Gallery for inspiration.