

Tutorial 3. Fridge Monitor#
The Fridge Monitor is a Juice service and dashboard pair for watching your setup’s infrastructure — especially cryogenic equipment — so instruments stay within safe operating conditions. A backend publishes readings (temperatures, pressures, currents, …) from your hardware, and the dashboard turns them into live graphs and controls.
This guide walks you through standing up a Fridge Monitor end to end, from an empty installation to a live dashboard.
Starting the Fridge Monitor service using the mock backend Juice ships by default, so no real hardware is required.
Configuring the dashboard to visualize the monitored data.
Watching it live to see it update live.
Next steps for connecting real hardware and going further.
We use the built-in mock backend throughout so you can follow along without a fridge attached — everything from configuring the service to setting up the dashboard works the same way once you point it at a real backend instead.
This tutorial exercises the Fridge Monitor service and the cryogenic hardware it talks to — see them highlighted in the architecture overview.
Required privileges
The steps in this guide are performed in the host system terminal by an administrator with sudo privileges, since they edit files under /etc/juice/config.
Starting the Fridge Monitor service#
Add the following to your orchestration.toml configuration, which registers a new service and points it at the mock backend’s application class:
[services.fridge]
entrypoint = "orangeqs.juice.fridge._service:FridgeService"
install_proxy = true

[services.fridge.init_kwargs]
application_class = "orangeqs.juice.fridge._mock_app:MockFridgeApplication"

[influxdb2.buckets.service-fridge]
name = "service-fridge"
Note
application_class is the recommended way to wire up a fridge backend —
see Writing a Custom Fridge Backend for how to write one. The older
init_module option (pointing at an entrypoint script) still works for
existing backends, but shouldn’t be used for new ones.
Apply the change and rebuild the service’s environment:
sudo juice install --restart --rebuild
Once this completes, check that the Juice interface shows a running fridge service.
The mock backend simulates a small fridge: five thermometers (from 50 K down to the mixing chamber), five heaters, two pulse-tube compressors and a gas handling system, all reporting on a timer. You can tune the simulated readings — or the reporting interval — through mock-fridge.toml; the defaults are enough to continue this guide.
Configuring the dashboard#
The dashboard does not automatically know which components to display or what to call them — that mapping is defined in fridge-monitor-dashboard.toml. Its defaults already match the mock backend’s component IDs, so writing an empty file is enough to get started; the snippet below spells the defaults out explicitly instead, since it doubles as a reference for what each option controls:
mode = "power_user"

[heaters]
heater_50K = "50K Heater"
heater_3K = "3K Heater"
heater_still = "Still Heater"
heater_mc = "Mixing Chamber Heater"
heater_sorb = "Sorb Heater"

thermometry_component_id = "thermometry_unit_1"

[thermometers]
thermometer_1 = "50K"
thermometer_2 = "3K"
thermometer_3 = "Still"
thermometer_4 = "50mK"
thermometer_5 = "Mixing Chamber"

[compressors]
pt_1 = "Compressor Unit 1"
pt_2 = "Compressor Unit 2"
Save this as fridge-monitor-dashboard.toml in your system configuration location (by default /etc/juice/config), then click the restart button on your dashboard to apply it.
Watching it live#
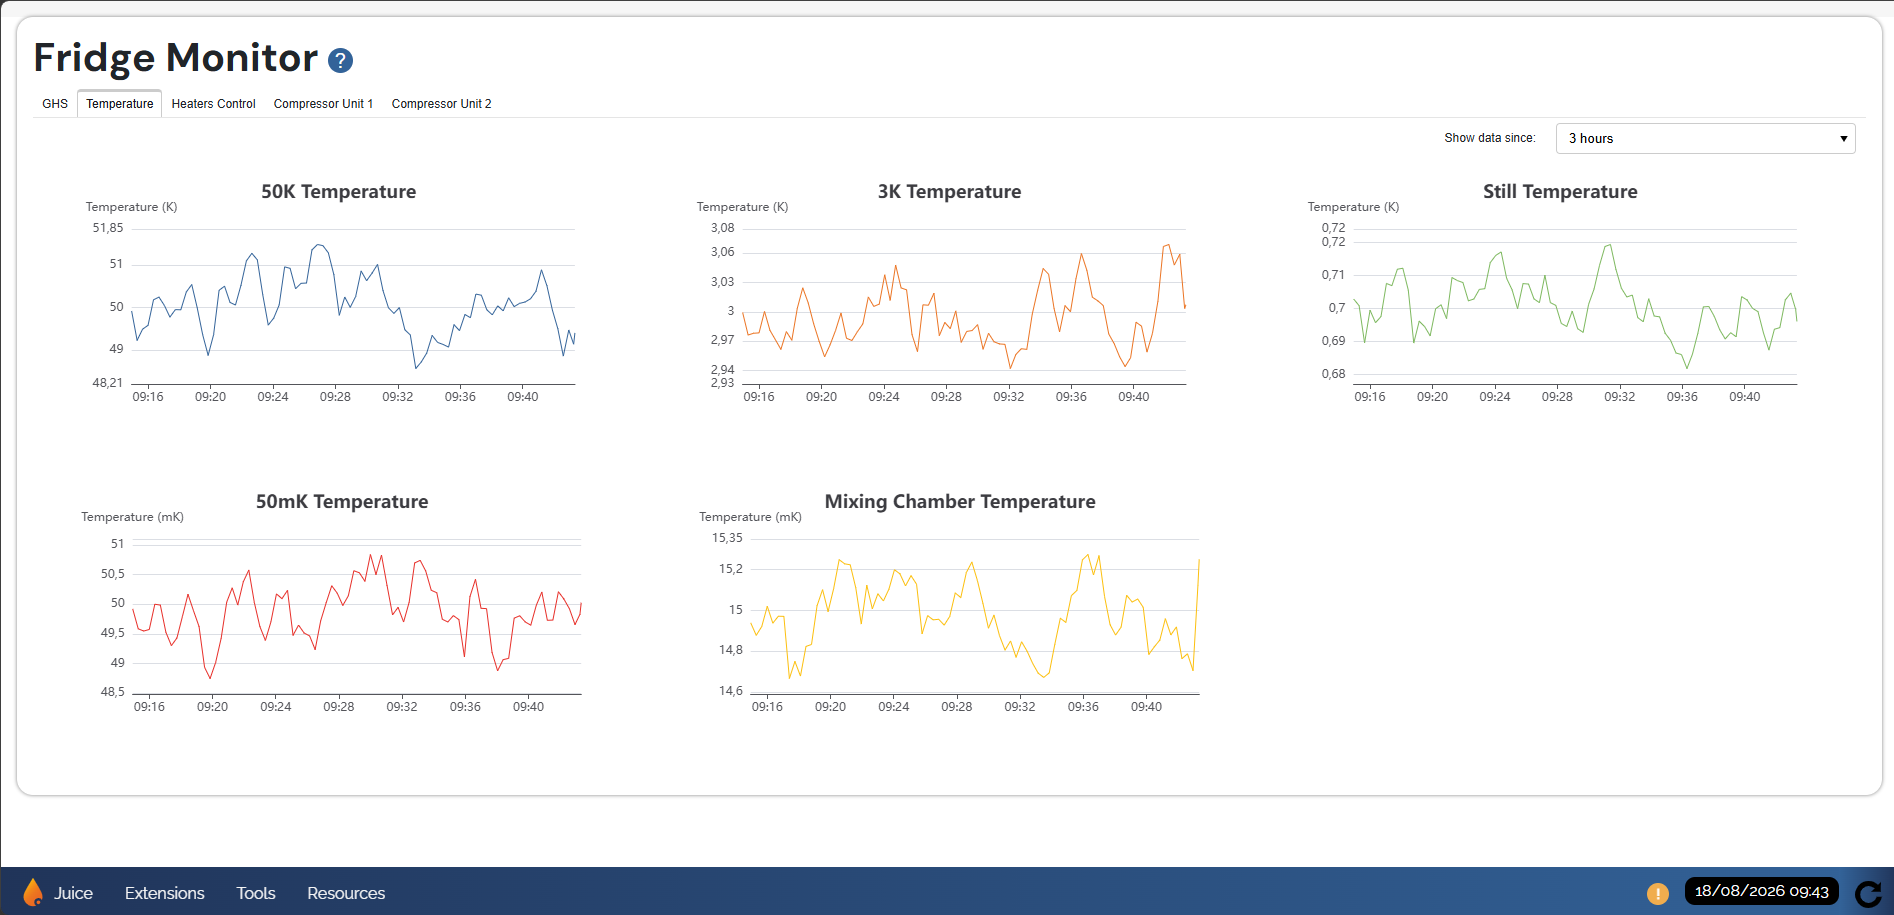
Open the Fridge Monitor page on the Juice dashboard. The mock thermometers’ temperatures, the compressors’ pressures and currents, and the heaters’ power draw update every few seconds — the same reporting loop that would drive the display for real hardware.
Next steps#
You now have a full Fridge Monitor running end to end, backed by a mock fridge — the service publishes data, and the dashboard visualizes it.
From here:
Continue to Tutorial 4. Parameter Monitoring and Throttling to watch one of these published values and automatically pause experiments if it drifts outside a safe range.
Follow the Writing a Custom Fridge Backend guide to swap the mock backend for your real cryogenic hardware; the service and dashboard configuration from this guide carry over unchanged.
Refer to the Creating a new dashboard page guide to add your own pages to the dashboard.