

Tutorial 4. Parameter Monitoring and Throttling#
Juice can watch any value published on a topic and automatically throttle (pause) experiment execution across the whole installation if it drifts outside a safe range — protecting shared hardware from experiments run under unsafe conditions. This tutorial sets that up end to end for a real value: the mixing chamber temperature from the mock Fridge Monitor you stood up in Tutorial 3. Fridge Monitor. See Parameter Monitoring and Throttling for the full configuration reference.
Finding a topic to monitor to find the exact topic to watch.
Configuring a monitoring unit to set warning and throttle thresholds for it.
Checking the throttle state to read the current throttle state.
Watching it flip from safe to throttled to see it flip from safe to throttled.
Next steps for what to explore from here.
We will assume you have opened and logged in to the OrangeQS Juice JupyterHub from your browser, and that Tutorial 3. Fridge Monitor is still running.
This tutorial exercises the Task Manager and the Fridge Monitor — see them highlighted in the architecture overview.
Finding a topic to monitor#
Parameter monitoring watches Juice pub/sub topics directly, so you need the exact topic string for the value you want to watch before configuring anything. Rather than guessing the format, list every topic your installation has seen with get_topics_last_seen_timestamp(), from any notebook:
from orangeqs.juice.client.topics import get_topics_last_seen_timestamp

get_topics_last_seen_timestamp()
{'fridge.thermometry_unit_1.thermometer_1': '2026-08-18T09:12:03Z',
 'fridge.thermometry_unit_1.thermometer_2': '2026-08-18T09:12:03Z',
 'fridge.thermometry_unit_1.thermometer_3': '2026-08-18T09:12:03Z',
 'fridge.thermometry_unit_1.thermometer_4': '2026-08-18T09:12:03Z',
 'fridge.thermometry_unit_1.thermometer_5': '2026-08-18T09:12:03Z',
 ...}
These are the five mock thermometers from Starting the Fridge Monitor service — thermometer_1 through thermometer_5, matching the [thermometers] names you configured in Configuring the dashboard (50 K down to Mixing Chamber). We’ll watch the coldest one, thermometer_5, since that’s the stage a real experiment would care most about.
Configuring a monitoring unit#
Each monitored topic is a juice_topic_monitoring_units entry — see Parameter Monitoring and Throttling for the full schema. Save this as parameter-monitor.toml in your lab repository’s config directory, ~/shared/lib/lab/src/lab/config/, so Juice picks it up automatically, the same way it already picks up src/lab/config/10-example.toml:
# src/lab/config/parameter-monitor.toml
[juice_topic_monitoring_units.mc_temperature]
display_label = "Mixing Chamber Temperature"
monitored_topic = "fridge.thermometry_unit_1.thermometer_5"
monitored_event_type = "orangeqs.juice.fridge.data_structures.TemperaturePoint"
monitored_field = "temperature"
unit = "kelvin"
warn_if_larger = 20.0e-3
throttle_if_larger = 25.0e-3
stop_throttle_if_smaller = 20.0e-3
The mock mixing chamber thermometer fluctuates around 15 mK, so these thresholds leave headroom for normal noise while still catching a real excursion. Restart the task manager to apply the change, then click the restart icon in the dashboard’s own navbar so the Parameter Monitor widget picks it up too:
from orangeqs.juice.client.service import restart_service

restart_service("task-manager")
Checking the throttle state#
The current state is published as a ThrottleStateEvent on throttle_state.<id>, where <id> is the key you gave the unit above (mc_temperature):
from orangeqs.juice.client.pubsub import subscriber_async
from orangeqs.juice.schemas.parameter_monitor import ThrottleStateEvent

subscriber = subscriber_async()
subscriber.subscribe(ThrottleStateEvent, topic="throttle_state.mc_temperature")

state = await subscriber.get()
print(state.throttled, state.value)  # ThrottleState.SAFE ~0.015
See Pub/Sub Communication for more on subscribing to events in general, and throttle_state.SYSTEM for the combined state across every monitoring unit at once.
Watching it flip from safe to throttled#
The mock thermometer stays close to its 15 mK baseline on its own, so to see a real state change without needing actual hardware, temporarily drop the thresholds below that baseline:
[juice_topic_monitoring_units.mc_temperature]
display_label = "Mixing Chamber Temperature"
monitored_topic = "fridge.thermometry_unit_1.thermometer_5"
monitored_event_type = "orangeqs.juice.fridge.data_structures.TemperaturePoint"
monitored_field = "temperature"
unit = "kelvin"
warn_if_larger = 10.0e-3
throttle_if_larger = 12.0e-3
stop_throttle_if_smaller = 10.0e-3
Restart the task manager and click the dashboard’s restart icon again, then re-run the subscriber cell from Checking the throttle state:
restart_service("task-manager")

subscriber = subscriber_async()
subscriber.subscribe(ThrottleStateEvent, topic="throttle_state.mc_temperature")

state = await subscriber.get()
print(state.throttled, state.value)  # ThrottleState.WARNING|THROTTLED ~0.015
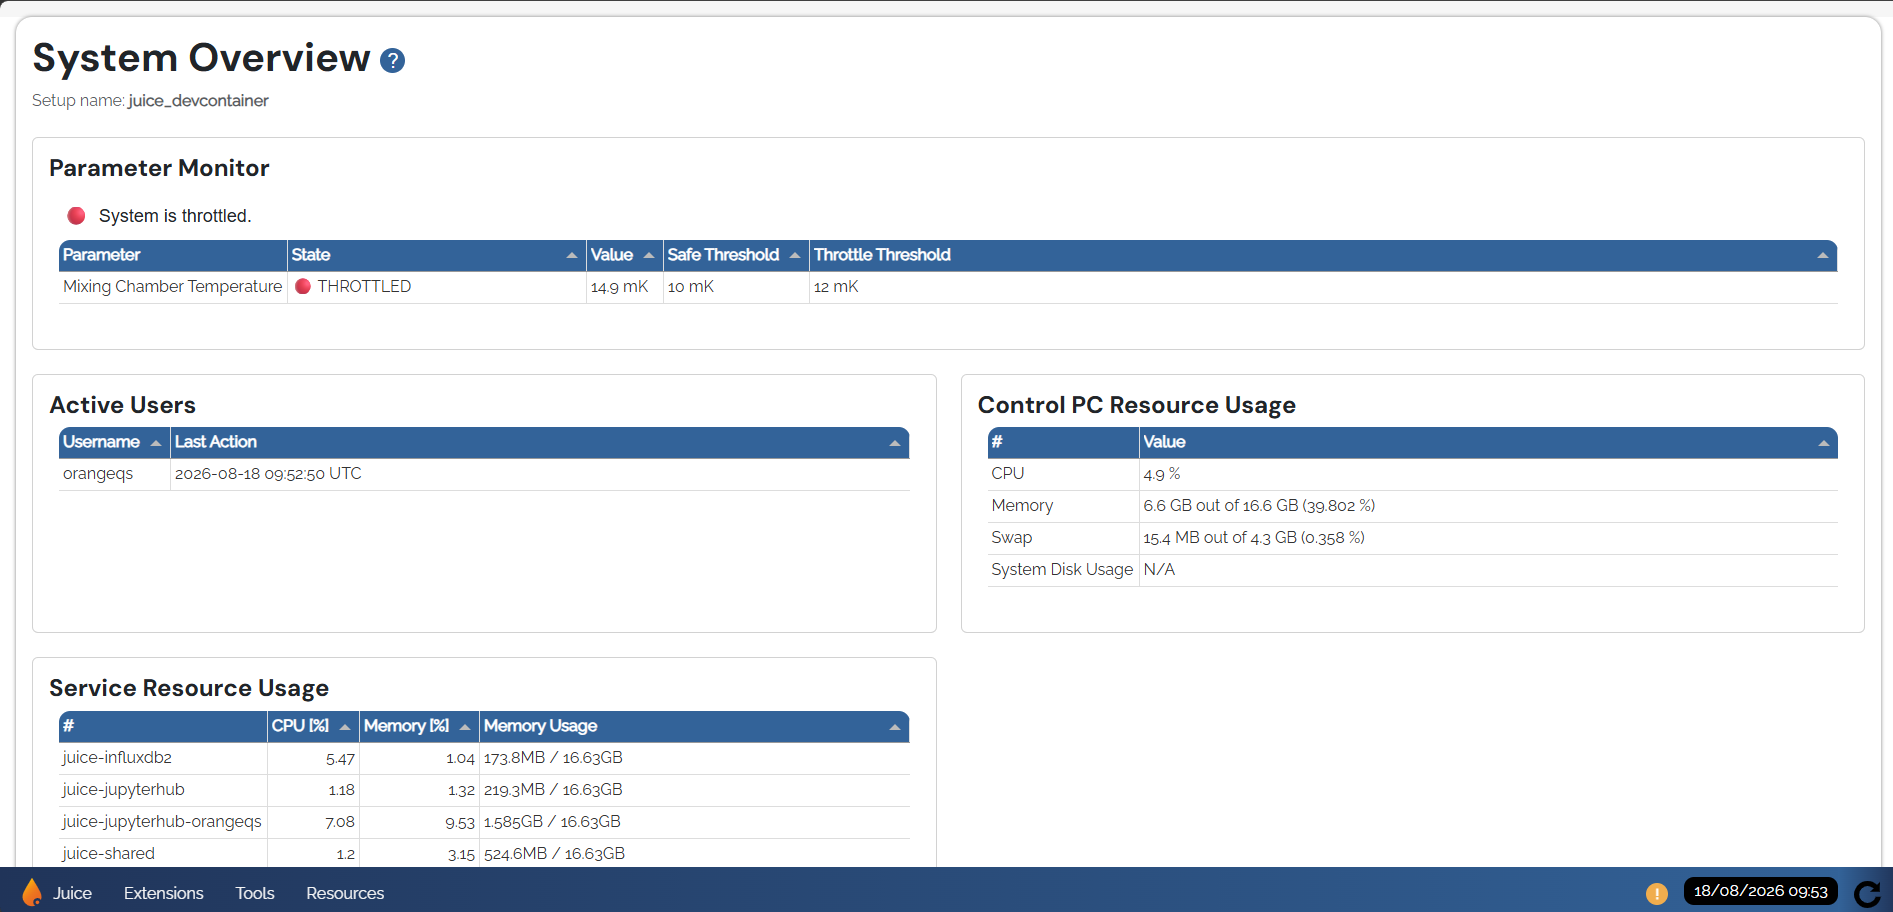
Once you’ve seen it flip, restore the realistic thresholds from Configuring a monitoring unit and restart the task manager and dashboard once more.
Next steps#
You’ve gone from a topic you didn’t know the name of to a fully configured safety throttle you watched trip live — the same mechanism protects every experiment on the installation, automatically, without any of them having to check for it themselves.
From here:
Refer to Parameter Monitoring and Throttling for the full configuration schema, including grace intervals to avoid throttling on brief spikes.
Refer to Setting Up Alerts to get throttle changes sent as email alerts instead of polling for them.
The same mechanism works for any topic, not just Fridge Monitor ones — publish your own event from a parameter used in Tutorial 1. Running an Experiment, and monitor that topic instead.