Dashboard#
This page outlines the working of Dashboard provided by OrangeQS Juice. This is followed by an explanation on how to add a dashboard application to Juice.
Dashboard is an interface provided by OrangeQS Juice to interact with the different processes running on the setup. This is implemented using a Panel (Holoviz) server that builds on Bokeh and Tornado’s HTTP Server. This is created for every user container.
A dashboard application (in the current dashboard) is either:
A Tornado
tornado.web.RequestHandlerA Panel app function with the signature
f(...) -> panel.template.TemplateA Bokeh app function with the signature
f(bokeh.document.Document) -> None(legacy)
A Panel app is also a Bokeh app since Panel sits on top of Bokeh and thus serves Bokeh documents. This means documentation referring to Bokeh apps or documents refer to Panel apps as well.
All three of these will result in an application. This application is given a distinct url that allows us to access it from the dashboard, if registered properly in pyproject.toml under [project.entry-points."juice.dashboard.bokeh"] (for Bokeh/Panel app functions) or [project.entry-points."juice.dashboard.tornado"] for Tornado handlers.
Currently, we use Bokeh to visualize data from different processes, as well as ECharts (for graphs and charts) and Tabulator (for tables) through their Panel integration. The layout for the Bokeh components is configured either in a page template, or in the configuration of the Bokeh document itself (legacy).
The dashboard allows for hosting multiple applications, for example, the Task Manager is an application with its distinct url. Within this application runs the Bokeh widget that displays relevant information.

The given image describes how the Juice dashboard works.
Now, we show how to configure a new dashboard application within OrangeQS Juice.
Configuring a dashboard application on OrangeQS Juice#
OrangeQS Juice comes with a default dashboard that uses base_juice.html to render Bokeh documents on the Juice page. The default dashboard currently supports Bokeh, ECharts and Tabulator (and all other Panel pane types) to visualize data.
Every Bokeh dashboard tab has an associated python module that defines the Bokeh widget(s). This python module adds the Bokeh widgets to the Panel template which contains the layout that will be rendered on the dashboard tab.
Page Templates#
Pages created with Panel for the Juice dashboard are template-based, meaning that to create a new page, one should first create a Jinja2 page template, which extends the base Juice page.
To create a new template:
Create a new .html file in the
orangeqs/juice/dashboard/templatesdirectory.Extend the base juice template. This template renders elements such as the navbar and OrangeQS logo.
Place your content in a Jinja block called “content”.
These templates should be as descriptive as possible and contain as much of the layout logic for a page as possible. For example:
{% extends "base_juice.html" %}

{% block content %}

<div class="block">
    <h2>My Page</h2>
    This is a variable: {{ my_variable }}
    <div id="my-widget">
        {{ embed(roots.my_widget) }}
    </div>
</div>

{% endblock %}
You can use Jinja’s double-curly brace syntax to use template variables. The places where widgets or dynamic content (like a Panel HTML pane) will be places are marked with double braces and use of the embed macro (provided by Panel, and automatically accessible when one extends from base_juice.html). This example also makes use of a HTML element ID (“my-widget”), which makes the widget more easily retrievable when creating UI tests later.
Layouts, like rows and columns, are also preferably defined in the page template, instead of by using Bokeh or Panel’s Row and Column. In practice this means that usually more roots is better than combining all the UI elements in a few roots. This makes the resulting page DOM clearer, makes the page layout itself more readable in a glance, and speeds up UI tests. For instance:
...
    <div class="block">
        <div class="column">
            <div id="service-logs-controls" class="row" style="align-items: center;">
                <div class="label"> Display {{ max_num_records }} messages until </div>
                <div id="datetime-picker"> {{ embed(roots.datetime_picker) }} </div>
                <div id="reset-datetime">{{ embed(roots.datetime_picker_reset_button) }}</div>
                <div class="label"> Level: </div>
                <div id="level-mc">{{ embed(roots.multichoice_level) }}</div>
                <div class="label"> Services: </div>
                <div id="service-mc">{{ embed(roots.multichoice_service) }}</div>
                <div id="service-log-warning" style="margin-left: auto;">
                    {{ embed(roots.warning) }}
                </div>
            </div>
            <div id="service-logs-table">
                {{ embed(roots.tabulator) }}
            </div>
        </div>
    </div>
...
As this example illustrates, the layout (rows and columns) are defined in HTML using the column and row CSS classes. Using a template like this makes it instantly clear what a page will consist of, while keeping the Python side of the code purely for logic.
Entrypoints#
To define the entrypoint of your app/page, you must follow these steps:
Create a Python module in
dashboard/pages.Define your entrypoint function. It should be of the signature
f(template_variables: dict[str, Any]) -> Template.Retrieve the template you made earlier and add variables and widgets to it.
Add your entrypoint function to the
pyproject.toml.
To use the template, one can use the get_panel_template helper function in JuiceEnvironment to retrieve the Template object by file name, which can then be used to add widgets and variables to. For example:
from orangeqs.juice.dashboard import juice_environment

def create_my_page_doc(template_variables: dict[str, Any]) -> Template:
    template = juice_environment.get_panel_template("my_page.html")

    widget = MyWidget()
    template.add_panel("my_widget", widget.root)
    template.add_variable("my_variable", 123)

    return template
As you can see, this entrypoint retrieves the template, populates it with a widget and a variable, and then returns it. To make the entrypoint visible to the Juice dashboard entrypoint system, it should be added to the pyproject.toml file under [project.entry-points."juice.dashboard.bokeh"], with the key being the path the page should be served under, and the value being the path to the entrypoint definition.
Creating dashboard widgets#
To create your dashboard widget and add it to an existing dashboard tab -
Create a Python module in
orangeqs/juice/dashboard/widgets.Implement your widget and the processes within, which should result in a class definition. E.g.
ControlPCOverviewTable.Expose a
.rootproperty or arootsfunction if your widget has multiple roots.Navigate to the app entrypoint you created earlier. Within this, instantiate your widget (and any variables if required) and add its root or roots to the template with
template.add_panel. This would then add it to the document itself and on the next start of the user server, we can see the newly added widget.
For example:
orangeqs/juice/dashboard/widgets/example_widget:
from panel.pane import HTML
from panel.viewable import Viewable
from panel.widgets import Select


class ExampleWidget:
    def __init__(self) -> None:
        self._colour_picker = Select(options=["Red", "Blue", "Green"])
        self._display = HTML("No colour selected yet.")
        self._colour_picker.param.watch(self.update_display, "value")

    def update_display(self, event) -> None:
        self._display.object = f"User picked colour: {event.new}"

    def roots(self) -> dict[str, Viewable]:
        return {"colour_picker": self._colour_picker, "colour_display": self._display}
orangeqs/juice/dashboard/pages/example_page.py:
from panel.template import Template

from orangeqs.juice.dashboard import juice_environment
from orangeqs.juice.widgets import ExampleWidget

def create_example_page(template_variables: dict[str, Any]) -> Template:
    template = juice_environment.get_panel_template("example_page.html")

    widget = ExampleWidget()
    for root_name, root in widget.roots().items():
        template.add_panel(root_name, root)

    return template
orangeqs/juice/dashboard/templates/example_page.html
{% extends "base_juice.html" %}

{% block content %}

<div class="block">
    <h2>My Page</h2>
    <div id="colour-picker">
        {{ embed(roots.colour_picker) }}
    </div>
    <div id="colour-display">
        {{ embed(roots.colour_display) }}
    </div>
</div>

{% endblock %}
Integration with Param#
Panel provides a number of useful functionalities to facilitate widget creation. One of these is Param. To see how Param can be used for widget creation, let us consider the HeatersWidget (part of the Fridge Monitor) as an example.
class SingleHeaterWidget(param.Parameterized):
    """Widget to control a single heater unit in the system monitor."""

    measured_power: float = param.Number(default=0.0)
    power_setting: float = param.Number(default=None, allow_None=True)

    def __init__(
        self,
        heater_name: str,
        display_name: str,
        mode: Literal["read_only", "power_user"] = "power_user",
    ) -> None:
        super().__init__()
As one can see, there are two Param parameters defined on this class. The class itself subclasses param.Parameterized to allow these parameters to function. In the init function, the superclass init is called as well.
The parameters defined on the class define the widget state. Not only does this make the widget state visible at a glance, it also allows widgets to be two-way bound to these parameters (if they are changed on the client, it will be automatically reflected on the server and vice versa), and it allows for functions to be called when these parameter values change. For instance, still using the HeaterWidget as an example:
        self.power_input = FloatInput.from_param(
            parameter=self.param.power_setting,
            placeholder="Enter Power",
            width=120,
            height=60,
            disabled=mode == "read_only",
        )

 ...

    @pn.depends("measured_power", "power_setting", watch=True)
    def _update_power_display(self) -> None:
        """Update the power display in the widget."""
        self.measured_power_display.object = self._return_power_display_text()
        logger.debug(
            f"Updated Power Display for {self.display_name}: "
            f"Measured Power Output: {self.measured_power} mW"
        )
Here, the power_setting parameter is two-way bound to a FloatInput standard Panel widget using from_param. Furthermore, @pn.depends is used to bind a function to measured_power and power_setting, ensuring that the power display is automatically updated when either of these parameters change. Setting watch=True is necessary here to allow for this behaviour.
See the official Panel documentation for more information.
Standard built-in Panel (and Bokeh) components#
Panel wraps many Bokeh widgets that Bokeh developers might already be familiar with, and adds quite a few more. A comprehensive list of these can be viewed in the Component Gallery in Panel’s official documentation. Panes include many (mostly) non-interactive visualisations that can be served even without embedding them in a page (with panel.serve), whereas widgets include interactive components like various buttons, input fields and button menus. Many of these also integrate with various powerful and mature JS libraries like Flatpickr, Tabulator. Even Bokeh plots are represented with Panes.
Both panes and widgets can be embedded into a page template using the embed macro and .add_panel on the Python side.
Because of Panel’s integration with Param, most of their components also include Param parameters that can be used for two-way bindings or bound functions. For instance, the Tabs layout component from Panel has an active parameter that can be used to bind a function to, which is used in the System Monitor.
from panel import Tabs
from param.parameterized import Event
...
        self.root = pn.Tabs(
            *[widget.tab_panel for widget in self.widgets],
            sizing_mode="stretch_width",
            dynamic=True,
        )
        self.root.param.watch(self._tab_changed, "active")
...
    def _tab_changed(self, e: Event) -> None:
        _logger.debug(f"Fridge Monitor Dashboard tab changed from {e.old} to {e.new}.")
        asyncio.create_task(self.widgets[e.new].initial_update())
Here, param.watch is used to automatically trigger the initial update of the widgets managed by the Tabs component.
Integration with JavaScript libraries#
Panel integrates with a great number of powerful, mature JavaScript libraries and provides a Pythonic API to interact with them. Two of them in particular, ECharts (Apache) and Tabulator provide great alternatives to Bokeh - ECharts for plotting and Tabulator for tabular data.
ECharts#
ECharts renders graphs entirely from a single option object, which can also be created in Python. The fields on this option define what the graph will look like and what data it will display. Below, there is a fully working example of an interactive, animated plot with ECharts and Param. The option object here is of interest, as it shows what an ECharts configuration looks like.
import panel as pn
from panel.widgets import FloatSlider
from panel.layout import Column
from panel.pane import ECharts
import param  # pyright: ignore[reportMissingTypeStubs]
from panel import depends
from panel.io.model import JSCode
import numpy as np

# pyright: reportUnknownMemberType = false
# pyright: reportAssignmentType = false
# pyright: reportArgumentType = false

pn.extension("echarts")

class ReactiveSineWave(param.Parameterized):
    amplitude: float = param.Number(
        default=1.0, bounds=(0.1, 5.0), step=0.1, doc="Amplitude of the sine wave"
    )

    phase: float = param.Number(
        default=0.0, bounds=(0.0, 2 * np.pi), step=0.1, doc="Phase shift"
    )

    def __init__(self) -> None:
        super().__init__()
        amp_slider = FloatSlider.from_param(self.param.amplitude)
        phase_slider = FloatSlider.from_param(self.param.phase)
        self.root = Column(
            amp_slider,
            phase_slider,
            self.plot
        )

    def advance_phase(self):
        """Increase the phase offset of the sinewave to animate the plot."""
        new_phase = self.phase + 0.2

        if new_phase >= 2 * np.pi:
            new_phase = 0.0

        self.phase = new_phase

    @depends("amplitude", "phase")
    def plot(self):
        x = np.linspace(-10, 10, 100)
        y = self.amplitude * np.sin(x + self.phase)

        option = {
            "animation": False,
            "tooltip": {
                "trigger": "axis",
                "formatter": JSCode(
                """(p) => `x: ${p[0].value[0].toFixed(3)} <br/>y: ${p[0].value[1].toFixed(3)}`
                """
                ),
            },
            "xAxis": {
                "type": "value",
                "min": -10,
                "max": 10,
            },
            "yAxis": {
                "type": "value",
                "min": -5,
                "max": 5,
            },
            "series": [
                {
                    "type": "line",
                    "showSymbol": False,
                    "data": np.column_stack([x, y]).tolist(),
                }
            ],
        }

        return ECharts(option, height=500, width=500)

def app():
    widget = ReactiveSineWave()
    pn.state.add_periodic_callback(widget.advance_phase, period=100)
    return widget.root

pn.serve({ "/": app })
This produces this widget:
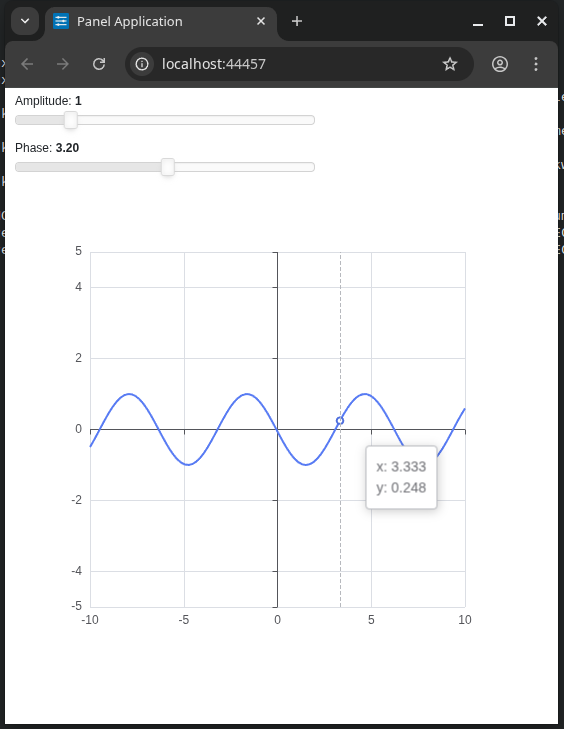
Note here that because ECharts is a JavaScript library, it takes JavaScript functions to define things like formatters. Panel provides a JSCode class to wrap Python strings as JS functions on the client.
@depends and from_param are Param functionalities. @depends automatically calls a function if either of the dependent parameters change. As you see in the example, you can pass a function that is annotated in this way to a pn.Column and it will update accordingly. from_param creates a two-way binding between the sliders and the parameters. If you run the snippet, you may for instance notice that the phase slider animates as well, because it is bound to the phase parameter which periodically updates.
This approach is not always scalable for frequent updates, as it creates a new ECharts pane each time. For better performance, a more imperative approach can useful. For instance, the TemperatureWidget in the Fridge Monitor does not rebuild the pane, but instead changes the object parameter in the pane. To update this parameter, param.trigger is used. For most parameters this is not necessary but because the object parameter is such a deeply nested object and because it is not completely re-assigned, calling trigger is necessary for the change to be detected.
        self.chart = ECharts(self._option, height=300, width=400)
...
        self._option["series"] = [
            {
                "name": sid,
                "type": "line",
                "showSymbol": False,
                "emphasis": {"focus": "series"},
                "lineStyle": {
                    "color": self.colors[i] if i < len(self.colors) else "#000000"
                },
                "data": [
                    [time, temp]
                    for time, temp in zip(
                        self.state[sid]["time"], self.state[sid]["temperature"]
                    )
                ],
            }
            for i, sid in enumerate(self.sensor_ids)
        ]
        self.chart.param.trigger("object")
Note that there are still edge cases where changing a deeply nested data structure will not be detected as a change by Panel, even when calling trigger. In these cases it is safest to just create a new dict or list and re-assign it to the option object. For instance:
self._option["series"] = [{
    "name": tuid,
    "type": "line",
    "smooth": False,
    "symbol": "circle",
    "animation": False,
    "data": list(experiment.points),
...
} for tuid, experiment in self._state.items() ]
Here, list() is called to explicitly create a new list so the change is detected.
A full list of values and formats the option object can take is shown in ECharts’s official API documentation.
Tabulator#
Tabulator provides powerful features for displaying data as a table, and can largely be used to replace Bokeh’s DataTable widget. The DataTableWidget under dashboard/widgets/common uses this library to allow users to quickly create tables with named rows and columns (the most common use case), though Tabulator can also be used directly. The ServiceLogWidget is an example of this:
    self.tabulator = pn.widgets.Tabulator(
        name="Service Logs",
        value=self._df,
        show_index=False,
        pagination="local",
        page_size=50,
        sizing_mode="stretch_width",
        titles={
            "_time": "Time",
            "service": "Service",
            "level": "Level",
            "message": "Message",
            "path": "File",
            "lineno": "Line",
        },
        formatters={
            "_time": {
                "type": "datetime",
                "inputFormat": "iso",
                "outputFormat": _DATETIME_FORMAT,
                "timezone": "UTC",
            },
            "path": HTMLTemplateFormatter(template=overflow_template),
            "message": HTMLTemplateFormatter(template=overflow_template),
        },
        layout="fit_data_stretch",
        stylesheets=[get_stylesheet("custom-bokeh.css")],
    )
Here, a Pandas DataFrame is used as a source for the Tabulator, illustrating how the library API integrates with the Python ecosystem. A full list of options can be found in both Panel’s official documentation as well as Tabulator’s (the latter being more comprehensive).
Styling Dashboard widgets#
There is a CSS file called custom-bokeh.css which sets styling rules for Bokeh widgets.
These can be applied to your widget by setting the stylesheets argument with an ImportedStyleSheet pointing to the path where the file is hosted.
We have defined a helper function, get_stylesheet(), that loads this stylesheet.
For now, our stylesheet defines styles for the following components.
It is shown per component how to apply these styles:
Data tables. Apply this to any data table that you use.
my_table = DataTable(
    stylesheets=[get_stylesheet("custom-bokeh.css")]
)