Architecture#
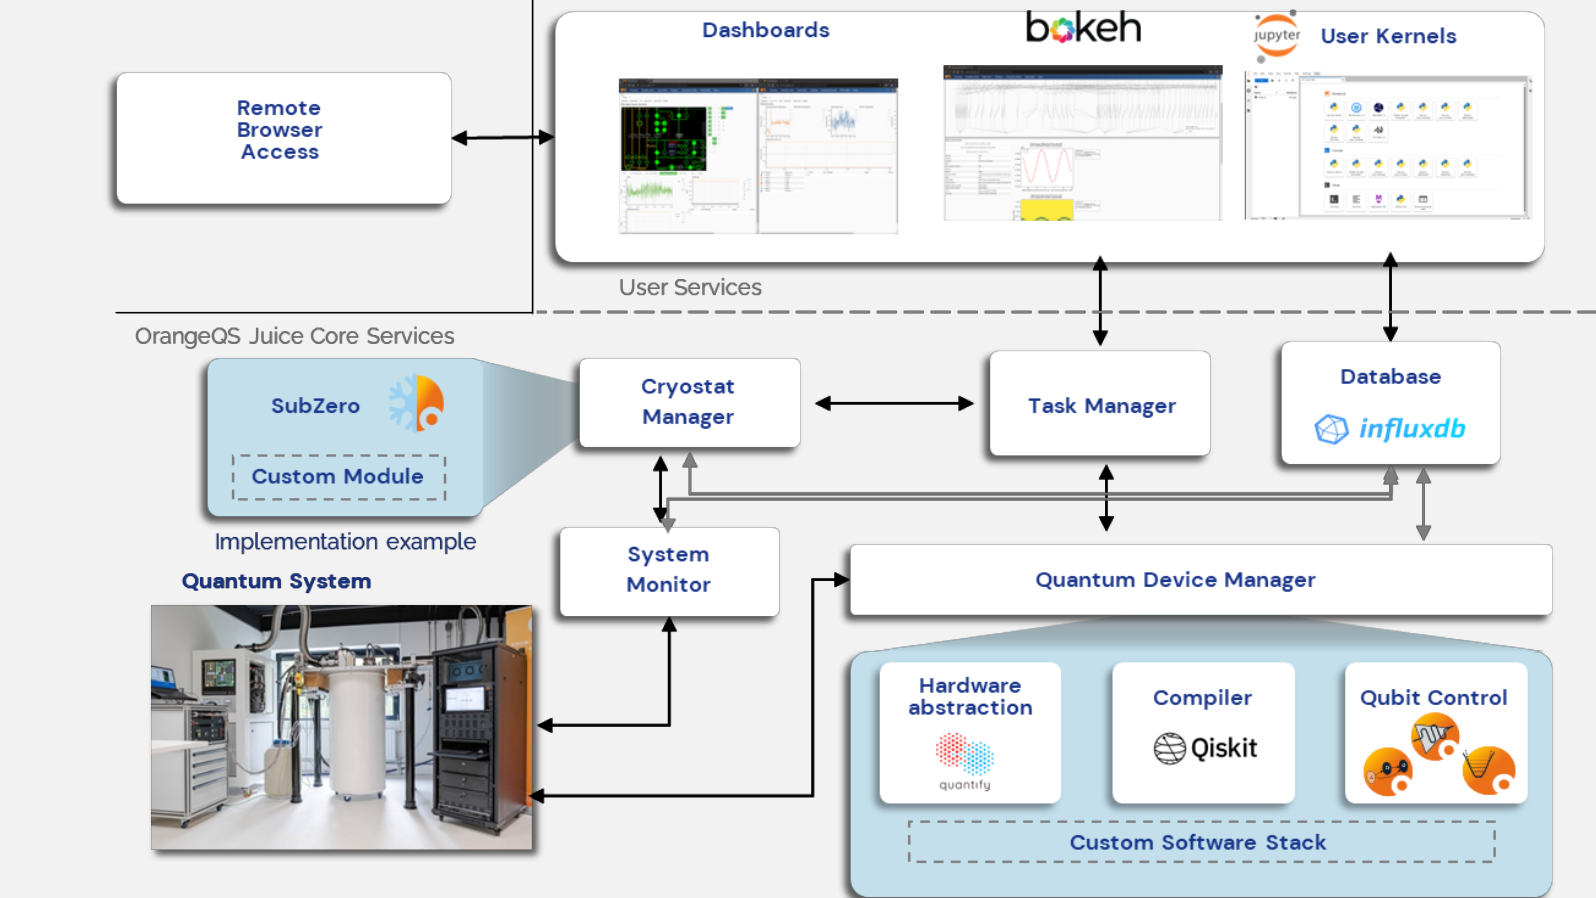
OrangeQS Juice is composed of several key components, including services, a database backend, and a JupyterHub server. The architecture is visualized below:
Jupyterhub#
JupyterHub provides user authentication and authorization, enabling a multi-user workflow. It serves as the primary advanced user interface for OrangeQS Juice, allowing users to interact with the system through familiar Jupyter notebooks.
Dashboard#
The Dashboard is the operator interface for managing an OrangeQS Juice deployment. It offers essential controls for:
Monitoring system status
Managing the lifecycle of the setup
Performing basic operational tasks
The dashboard can also be extended with custom widgets as per a labs needs, see ()
Services#
Each OrangeQS Juice Service is implemented as an IPython kernel, initialized with a custom script tailored to its specific role within the framework. These services are essential for managing and interacting with shared hardware and system resources.
A standard OrangeQS Juice installation includes the following core services:
Task Manager: Coordinates task execution, manages resource access, and enforces authorization and prioritization.
System Monitor: Tracks the health and status of the system, providing diagnostics and performance metrics.
Just like Dashboards, Services are extensible. Users can create new services or customize existing ones to better fit their experimental setups or workflows.
Task Manager#
To facilitate shared access to resources (such as services), OrangeQS Juice routes requests through the task manager. The task manager is responsible for managing matters such as authorization, priority and locking of resources. The Client API sends requests (tasks) to the task manager, which the task manager forwards to the requested service if appropriate. Consequently, the task manager receives the result and sends it back to the client.
System Monitor#
The System Monitor is a feature primarily designed to oversee and manage your cryogenic equipment. It provides a standardized set of interfaces that hardware drivers can implement. Users can use the provided APIs to then spawn a service that monitors your equipment.
Key features include:
Device Communication: The service handles all communication with the connected devices.
Data Logging: It automatically dumps data into a database for historical tracking and analysis.
Dashboard Integration: All monitored data is visualized on a centralized dashboard for real-time insights.
Custom Monitoring: You can configure the service to monitor any component in your setup—not just cryogenic systems.
Alerts & Throttling: Set up warnings and automated throttling of experiments based on monitored parameters to ensure safety and stability.
This makes the System Monitor a flexible and powerful tool for maintaining control and visibility over complex experimental setups. For more details, see System Monitor