

Tutorial 1. Running an Experiment#
This tutorial covers the basic building blocks for running an experiment: storing data where it survives restarts, tagging a run so you can find it again, watching it live, and scheduling it to run later. None of these are specific to any one experimental framework.
In this tutorial, we use Quantify — the framework that OrangeQS Juice recommends by default, installed in the lab package — purely as a concrete, runnable example. Swap in your own framework’s calls wherever you see meas_ctrl, Plotmon or Insmon, and every other step still applies unchanged.
We will assume you have opened and logged in to OrangeQS Juice from your browser.
This tutorial exercises the Task Manager and the shared service — see them highlighted in the architecture overview. Tutorial 2. Scheduling your experiment picks up right where this one ends, scheduling the exact experiment you build here.
Where to run this
Getting the kernel wrong is the most common way to get confusing results in this tutorial, so: every code cell in this tutorial runs inside the shared kernel, not your personal notebook. This kernel is accessible to everyone who can log in to the system, and can therefore see/pick up your work.
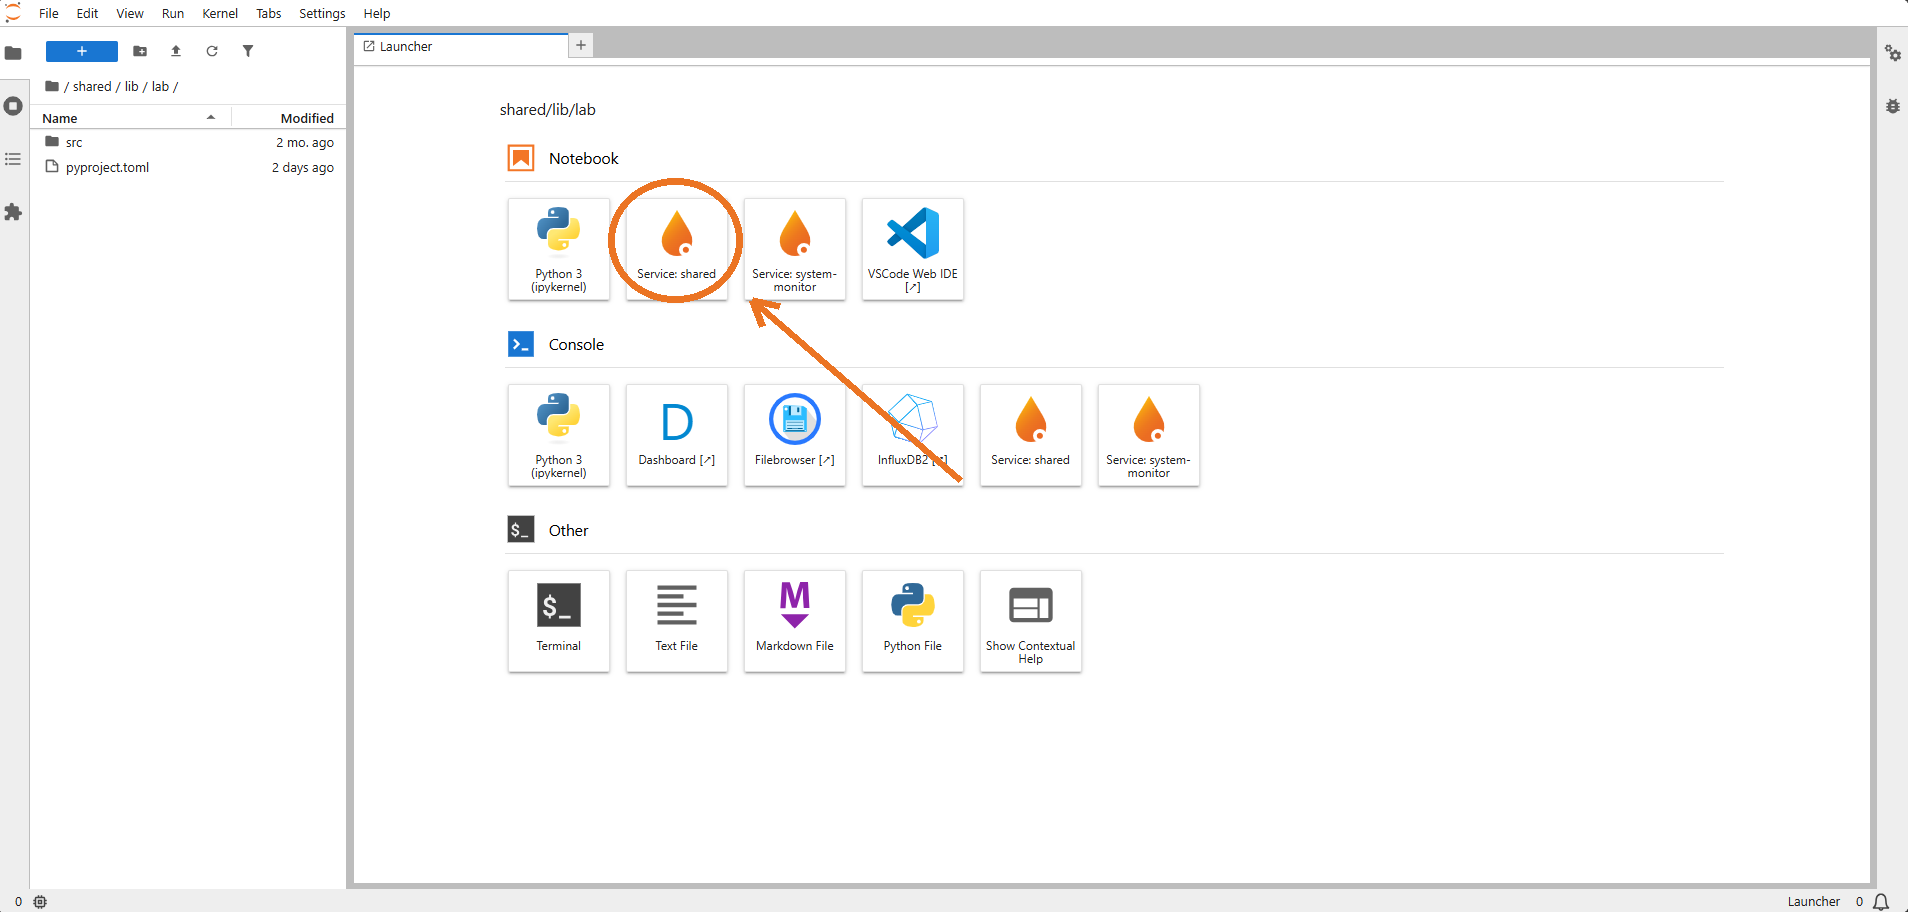
Press the + icon to open the JupyterHub Launcher, then select Service: shared under either Notebook or Console — this opens a Proxy Kernel (see Through a proxy kernel for the full explanation). Run every code cell below in that kernel.
Configuring the data directory#
Quantify stores datasets and compiled schedules under a datadir that you configure yourself. In OrangeQS Juice this must live under the shared folder rather than a per-container path, so your data survives restarts and stays visible to every user. The convention is ~/shared/data/quantify:
from pathlib import Path
import quantify.data.handling as data_handling

data_handling.set_datadir(Path.home() / "shared" / "data" / "quantify")
Defining a minimal experiment#
To keep the focus on Juice’s integration rather than on Quantify’s device and hardware model, we use a minimal experiment that needs no real or mock hardware: a ManualParameter swept against a Parameter that computes a sine wave.
import numpy as np
from qcodes import ManualParameter, Parameter
from quantify.juice.measurement_control.measurement_control import MeasurementControl

meas_ctrl = MeasurementControl("meas_ctrl")

x = ManualParameter(name="x", label="X", unit="s")
signal = Parameter(name="signal", label="Signal", unit="V", get_cmd=lambda: np.sin(x()))
For a real experiment with actual instruments, schedules and hardware compilation, follow Quantify’s Tutorial 1: Running an Experiment — everything from here on applies the same way regardless of how the experiment itself is built.
Tagging the run with a run ID#
A run ID is an identifier tied to a service and timestamp - with your own name and description attached. You can use the ID, name or description to find the run later using search_run_ids().
from orangeqs.juice.identifiers.run_id import new_run_id, current_run_id

new_run_id(
    name="quantify_demo_run",
    description="Sine-wave demo run from the quantify-experiment tutorial",
)
run_id = current_run_id()
print(run_id)  # e.g. "run_shared_20260817140213"
All Quantify data written to the configured data directory from here on is automatically tagged with this run ID, so you can find it again later by run ID as well as by dataset name or label.
Live monitoring with Plotmon and Insmon#
Plotmon live-plots measurement data as it comes in; Insmon live-publishes a snapshot of your QCoDeS instrument parameters.
from quantify.juice.insmon import InstrumentMonitorPublisher
InstrumentMonitorPublisher().start() # Start the Instrument Monitor

meas_ctrl.attach_plotmon() # Start the live Plot Monitor
Both start updating as soon as Running the experiment starts producing data:
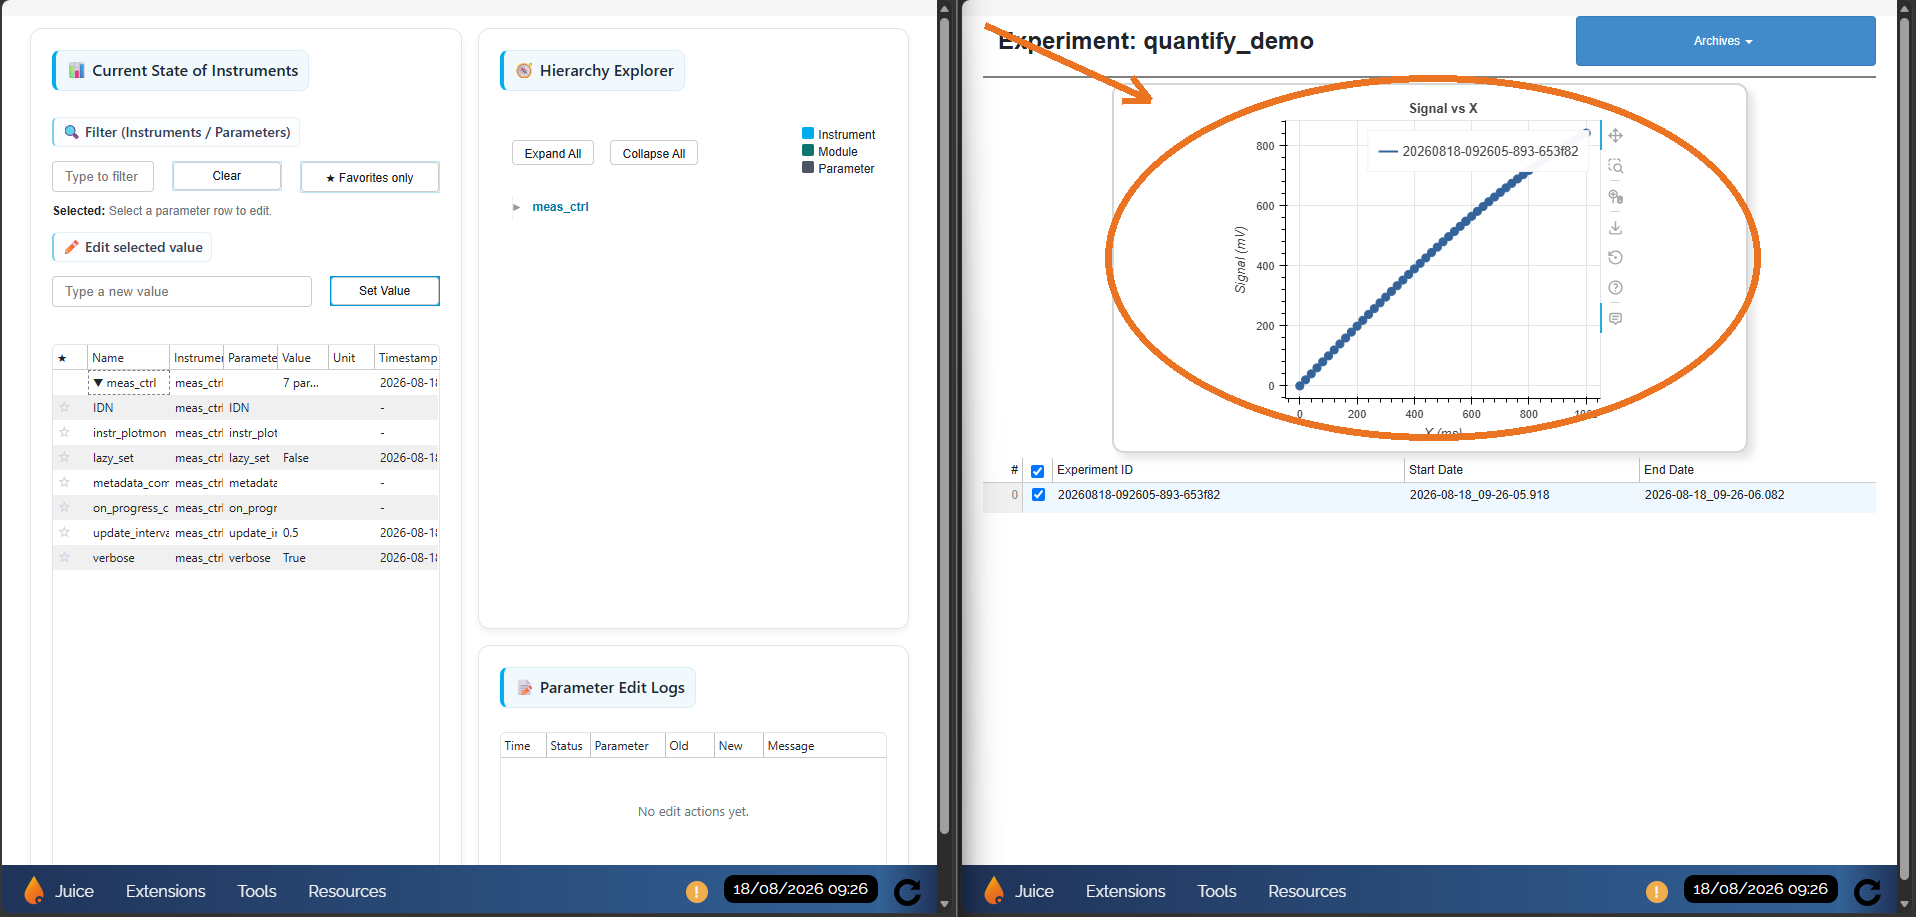
See Quantify’s how-to guide for the full reference on Plotmon and Insmon.
Running the experiment#
Still in the shared kernel:
meas_ctrl.settables(x)
meas_ctrl.setpoints(np.linspace(0, 1, 51))
meas_ctrl.gettables(signal)
meas_ctrl.run("quantify_demo")
Watch Plotmon and Insmon update live while this runs.
Finding the run in the experiment browser#
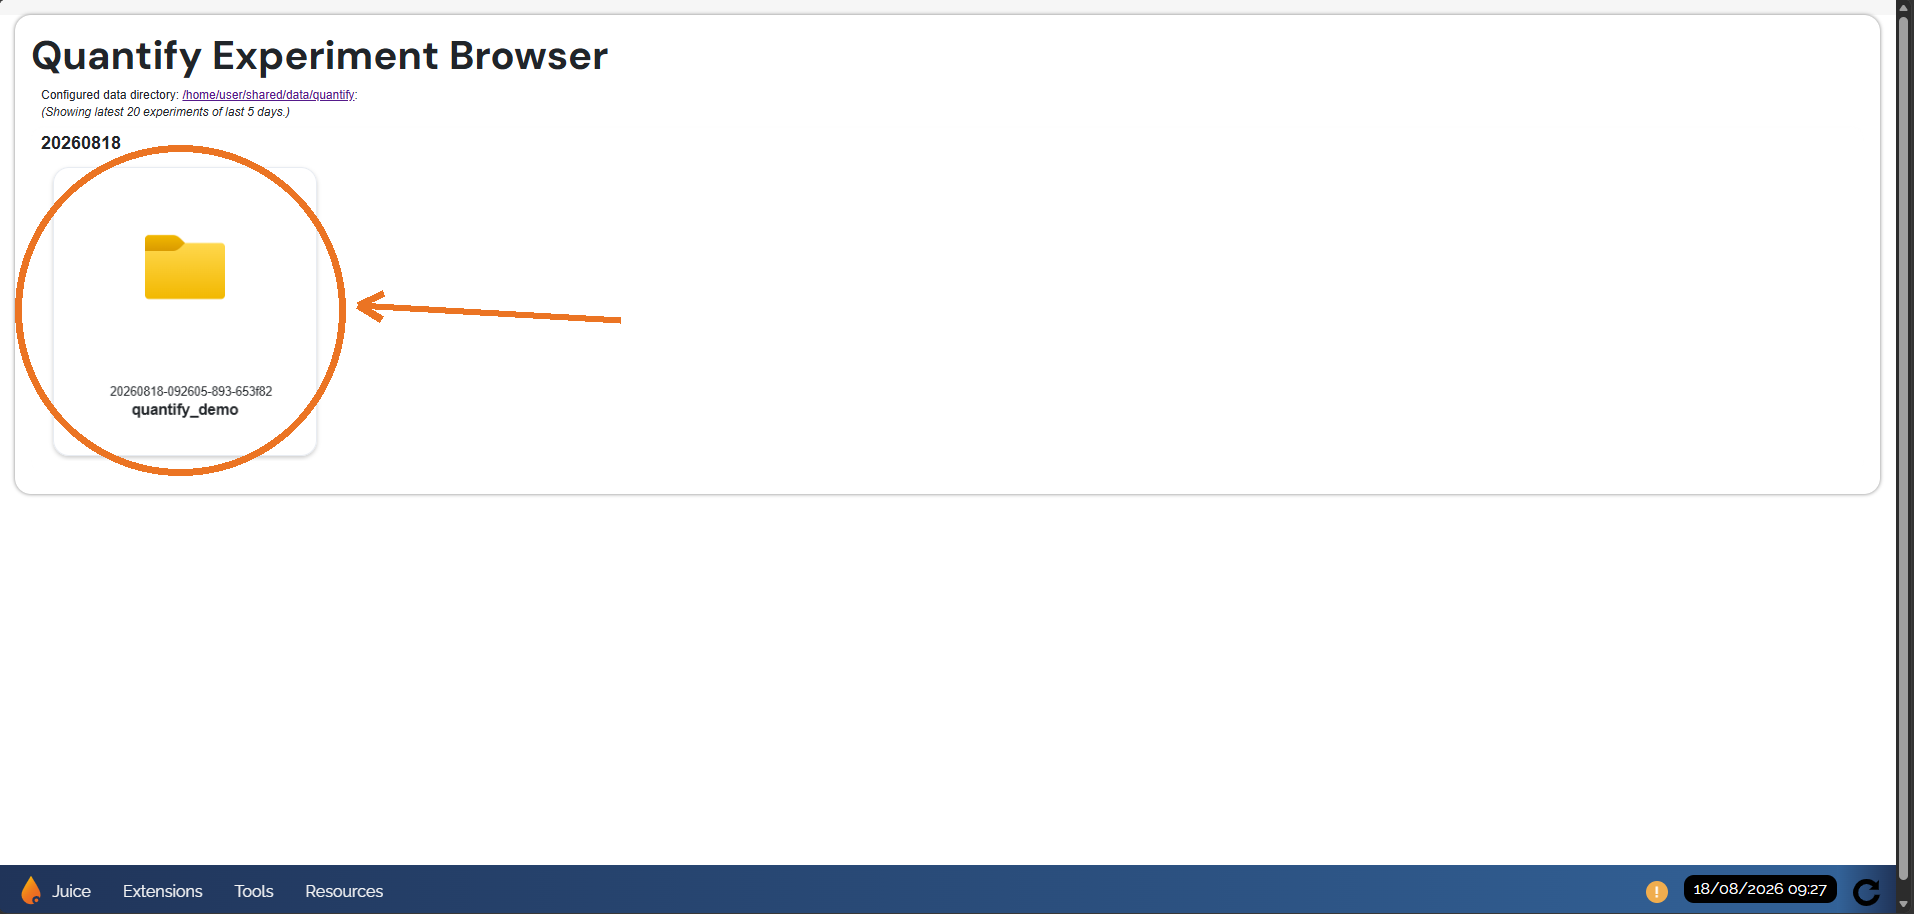
Quantify’s Juice integration ships an experiment browser dashboard page, listing every dataset written under your datadir. Open it on the Juice dashboard and find quantify_demo in the list.
Adding the experiment to the lab repo#
So far, x, signal and meas_ctrl only exist as cells in the shared kernel — fine for exploring, but nothing outside that kernel can reuse them. Tutorial 2. Scheduling your experiment schedules this same experiment from a task, and a task’s code has to be importable by whatever service runs it, so move it into the lab repository first. This is a shared Python package every user and service already has installed (see Lab repository for the full guide). This repository comes pre-installed with OrangeQS Juice and it is good practice to always commit your work to this repository.
Create src/lab/quantify_demo.py, wrapping the experiment in a function:
# src/lab/quantify_demo.py
import numpy as np
from pathlib import Path
from qcodes import ManualParameter, Parameter
import quantify.data.handling as data_handling
from quantify.juice.measurement_control.measurement_control import MeasurementControl


def run_quantify_demo() -> None:
    data_handling.set_datadir(Path.home() / "shared" / "data" / "quantify")

    meas_ctrl = MeasurementControl("meas_ctrl")
    x = ManualParameter(name="x", label="X", unit="s")
    signal = Parameter(name="signal", label="Signal", unit="V", get_cmd=lambda: np.sin(x()))
    meas_ctrl.attach_plotmon()

    meas_ctrl.settables(x)
    meas_ctrl.setpoints(np.linspace(0, 1, 51))
    meas_ctrl.gettables(signal)
    meas_ctrl.run("quantify_demo")
Then commit it, from a terminal in the lab repository. If this is the first time you’re using the lab repository, uncomment the lines below to put it under version control first (see Setting up version control for the full guide):
cd ~/shared/lib/lab

# First time using this lab repository? Uncomment and run these lines first.
# git init -b main
# git config --global user.email "[email protected]"
# git config --global user.name "Your Name"

git add .
git commit -m "Add quantify_demo experiment"
Since the lab package is installed everywhere, you can now call this from any kernel, including the shared one you’ve been using throughout this tutorial. Restart that kernel first, though - to clear the variables from earlier in the demo.
from lab.quantify_demo import run_quantify_demo

run_quantify_demo()
Next steps#
You have gone from an idle notebook to an experiment that runs, monitors itself live, and lives in your own repository ready to be reused — and every step along the way was just Python function and method calls. There is no special Juice API for “running an experiment”: every snippet above runs directly in a notebook cell on its own, with no task involved, and you can bring in any other Python library (numpy, scipy, matplotlib, a custom driver, or anything else) the same way.
From here:
Continue to Tutorial 2. Scheduling your experiment to schedule
run_quantify_demoto run later instead of right now, using OrangeQS Juice’s task framework.Follow Quantify’s own tutorials to build real experiments with devices, schedules, hardware compilation, and sweeps or analysis.
Refer to Quantify’s how-to guide for the full reference on Insmon, Plotmon and the experiment browser.